1. Taste Perception: More than Meets the Tongue
JOANDREA HOEGG
JOSEPH W. ALBA*
Perceptual discrimination is fundamental to rational choice in many product cat-
egories yet rarely examined in consumer research. The present research inves-
tigates discrimination as it pertains to consumers’ ability to identify differences—or
the lack thereof—among gustatory stimuli. Three experiments reveal systematic
bias resulting from the presence of common visual and verbal product cues. Par-
ticularly noteworthy is the finding that the amount of bias induced by a subtle,
nonevaluative cue can far exceed the bias induced by overt and well-established
evaluative cues. In addition, the effects these cues have on perceptual discrimi-
nation diverge from the effects they have on preference.
I t has been argued that, at its essence, decision making is
the task of distinguishing one option as superior to others
in overall value (Russo and Carlson 2002). As such, decision
than as the decision itself. Thus, we largely examine non-
evaluative responses to stimuli that contain no objectively
superior option. In so doing, we negate many—but not
making becomes onerous when differences in overall utility all—of the biases that lead to errors of discrimination. Our
are subtle and identification of the superior option requires focus is on biases that remain when the individual is mo-
complicated or unpleasant trade-offs (Hammond, Keeney, tivated to recognize the true level of similarity that exists
and Raiffa 1998; Luce, Payne, and Bettman 2001). Although across alternatives. Third, unlike the vast majority of re-
it is generally accepted that the goal of nonperverse decision search that presents decision makers with alternatives char-
makers is to obtain the greatest overall utility, a considerable acterized by verbally describable features, we explore sen-
amount of decision research has been devoted to showing sory discrimination.
how suboptimal decisions may result from inherent human Although it is possible to assess sensory discrimination
bias. A bias that is particularly noteworthy from the per- from a psychophysical perspective by mapping differences
spective of value discrimination is the propensity to exag- in sensation to purely physical differences in the stimulus,
gerate the true difference in performance across options—a consumers rarely experience products under such pristine
conditions. The existence of meaning-laden cues in the en-
propensity that itself is prompted by a variety of cognitive
vironment may lead not only to degradation in discrimi-
and motivational biases (Brownstein 2003).
nation but also to distortion. The present research resides at
The present research is likewise concerned with discrim-
the interface of perception and cognition by examining the
ination among alternatives but differs from the main body
potential biasing effects of commonplace visual and verbal
of research in three significant but related respects. First, cues as they apply to taste discrimination.
the emphasis is on discrimination at the level of an indi-
vidual attribute rather than overall utility. Thus, decision
difficulty obtains from discerning differences, or the lack COMPETING CUES
thereof, among alternatives on a single product dimension It appears that consumers are neither adept at taste dis-
rather than from making trade-offs across different dimen- crimination nor cognizant of the extent of their ineptitude
sions (Hoch 2002). Second, discrimination is considered in (Lau, Post, and Kagan 1995). Anecdotal evidence suggests
its fundamental role as a precursor to decision making rather that even experts can fail to discriminate between red and
white wine in blind tests that control for temperature (Mat-
*JoAndrea Hoegg is assistant professor of marketing, University of Brit- thews 1996). It may be argued that wine constitutes a par-
ish Columbia, Vancouver, BC, V6T 1Z2 (joey.hoegg@sauder.ubc.ca). Jo-
seph W. Alba is distinguished professor of marketing, University of Florida, ticularly complex and subtle discrimination problem. How-
Gainesville, FL, 32611 (joe.alba@cba.ufl.edu). Correspondence: JoAndrea ever, consumers rarely conduct blind taste tests. The
Hoegg. The authors express their gratitude to the reviewers for their helpful presence of competing visual and verbal cues may hinder
suggestions and to the editor for his encouragement. discrimination of truly differentiated options.
This problem can be cast in terms of cue diagnosticity.
John Deighton served as editor and Joseph Priester served as associate
editor for this article. An influential model suggests that consumers base decisions
on accessible and diagnostic information (Lynch, Marmor-
Electronically published December 5, 2006
stein, and Weigold 1988). Our use of a stimulus-based par-
490
2007 by JOURNAL OF CONSUMER RESEARCH, Inc. ● Vol. 33 ● March 2007
All rights reserved. 0093-5301/2007/3304-0008$10.00
2. TASTE PERCEPTION 491
adigm neutralizes the role of accessibility. The effect of di- Matta 2004; Krider, Raghubir, and Krishna 2001; Raghubir
agnosticity should be similarly straightforward because we and Krishna 1996). In substance, our research diverges from
ask consumers not for an evaluative decision about supe- volume perception in several ways aside from the obvious
riority but rather for a nonevaluative judgment of difference domain- and task-related differences in the psychophysical
along the single dimension of taste. Taste is the most “di- judgment (i.e., volume vs. taste and magnitude estimation
agnostic” cue, inasmuch as it is isomorphic with the judg- vs. stimulus discrimination). First, whereas volume is com-
ment. puted from multiple cues by necessity, our taste stimuli vary
along a single dimension. Second, we direct consumers to
the dimension of interest but provide other cues—both visual
Verbal Cues. The diagnosticity of taste notwithstand- and verbal—that are objectively irrelevant to the taste-dis-
ing, nontaste cues such as brand labels have been shown to crimination task. Moreover, whereas research on volume
exert a large influence on preference (Allison and Uhl 1964; perception is able to specify the salience of competing cues
Hoyer and Brown 1990). However, the extent to which such a priori and then assess the extent to which judgment is
influence extends to discrimination tasks is not entirely clear biased by salience, a primary objective of the present re-
for two reasons. First, research on perceptual learning sug- search is to determine the relative influence of several com-
gests that labels affect perceptual discrimination only after monly available cues. Despite the considerable body of re-
an initial learning phase in which the labels have been clearly search on marketing-related cues, there is no basis on which
associated with specific sensory values (Goldstone 1994; to anticipate their biasing power vis-a-vis a visual cue.
`
Hoegg and Alba 2007). Consumer contexts are rarely char- The present experiments use several procedures that not
acterized by such directed learning. Second, the influence only allow strong tests of the effects of visual and verbal
that labels have been shown to exert on preference may cues on taste perception but also broaden the question in
reflect cognitive or social responses to promotional efforts ways that are pertinent to the consumer context and to related
rather than true perceptual distortion. research on preference. With regard to visual cues, we assess
consumers’ ability to appreciate (a) the difference between
Visual Cues. Humans rely heavily on visual informa- stimuli that differ in taste but not color and (b) the absence
tion to navigate the world. Visual cues generally serve us of difference between stimuli that differ in color but not
well, particularly when aligned with other sensory cues. taste. Both discriminations are tested against a same-color
However, sensory cues do not always act in concert, such control. This design enables a test of the effect of visual
as when visual and kinesthetic cues are intentionally mis- cues at two levels. At one level is the basic comparison of
matched to produce exaggerated feelings of motion in at- the color and control conditions. An interpretable effect of
tractions found at entertainment parks. Evidence suggests color would result in across-color exaggeration and within-
that conflicts between visual and other sensory cues tend to color minimization of differences in taste. A stronger test
be resolved in favor of vision (Posner, Nissen, and Klein examines whether color dominates taste such that there is
1976). The preponderance of research on such visual dom- greater perceived similarity between two stimuli that share
inance has focused on conflicts between visual cues and the same color but differ in taste than between two stimuli
either kinesthetic or auditory cues. In contrast, the present that share the same taste but differ in color. Experiments 1
focus is on the interaction of visual and gustatory cues. Our and 2 enable both tests. With this design, taste is the only
specific focus is on the conflict between color and taste—an diagnostic cue and, as such, should be the basis for judg-
interaction that is not without precedent in marketing re- ment. Color is often diagnostic of taste but not in this in-
search and practice. Color is manipulated by firms to signal stance. Thus, the design allows for assessment of competing
freshness and taste and has been shown empirically to be cues, one diagnostic and one nondiagnostic. A different but
effective at influencing perceptions of flavor intensity (Del- unexplored way to calibrate the effect of color is to compare
wiche 2004). Research has also demonstrated that inappro- its influence to the influence of common verbal product-
priate colors (e.g., juice that is grape in flavor but green in related cues that previously have been shown to exert a
color) can influence liking, identification, and perceptions strong effect on consumer perceptions and beliefs. Experi-
of quality (Garber, Hyatt, and Starr 2000; Stillman 1993). ment 2 performs such a comparison. Finally, a different but
Although affective and evaluative response is clearly im- no less important question concerns the extent to which
portant, we focus on how perceptual discrimination is in- discrimination maps onto preference. Discrimination is a
fluenced by subtle color differences that are unlikely to pro- natural precursor to preference, but the relationship between
duce directional expectations of quality or preference. the two has not been investigated. Experiment 3 explores
At a more general level, our interests are similar in spirit how marketing cues differentially impact discrimination and
to recent consumer research on visual psychophysics. For preference.
example, it has been shown that package shape can bias
perceptions of volume—which in turn may influence con-
sumption behavior and satisfaction (Raghubir and Krishna
EXPERIMENT 1
1999; Wansink and Van Ittersum 2003)—and that such bias In all experiments, orange juice served as the stimulus
is driven in part by inappropriate attention to salient but category due to the ease with which its taste and appearance
misleading physical properties of the stimulus (Folkes and characteristics can be manipulated. In the present experiment
3. 492 JOURNAL OF CONSUMER RESEARCH
we consider subtle color differences (i.e., similar hues of the identical samples was small but nonzero, perhaps re-
orange) and variations in sweetness. We examine the influ- flecting conservatism in scale usage, compliance with in-
ence of color differences against two benchmarks. The first structions to assess “differences,” or both. Posttaste proto-
benchmark is a same-color control condition. The second cols support at least the latter. Regardless, the key measures
benchmark is a verbal-label condition that should prompt in the main experiment involve differences in perception
expectations of a taste difference between two samples with across conditions, rather than absolute judgments.
different labels. Specifically, we refer to region of origin— The juice stimuli presented to participants in the main
California versus Florida—to examine how meaningful la- experiment consisted of one sample of low-sweet, two sam-
bels affect taste discrimination. ples of medium-sweet, and one sample of high-sweet orange
juice. The four samples in the control condition were iden-
Method tical in color and were labeled 1, 2, 3, and 4, with cups 2
and 3 containing medium-sweet juice and cups 1 and 4
Design and Participants. The study employed a 3 (re- containing high- or low-sweet juice (counterbalanced). In
gion label, color, control) # 2 (same taste vs. different taste) the region condition, two samples were identified as origi-
mixed design, with the former manipulated between partic- nating in California and two in Florida. Within each region,
ipants and the latter within participant. A total of 59 un- one sample was medium sweet and one was either high or
dergraduate students at the University of Florida participated low sweet (counterbalanced). Consequently, one sample of
for class credit and were randomly assigned to the three California and one sample of Florida were identical in taste
between-subjects conditions. (both medium sweet); within each region, the two items
were different in taste (either medium and high or medium
Stimuli. The test stimuli consisted of two pairs of sam- and low). In the color condition, different hues of orange
ples: (a) samples with the same taste but different colors or substituted for region labels. For purposes of identification,
labels and (b) samples with different tastes but the same the numerical labels used in the control condition again were
color or label. Testing was limited to these pairs for the applied. Two of the four samples (one medium sweet and
combined reason that multiple tastings quickly reduce acuity one high or one low sweet, counterbalanced) were darkened
and the remaining cells of the full factorial (e.g., different slightly by adding a drop of flavorless yellow McCormick
taste with a different color) are relatively uninformative with food dye per 100 milliliters of orange juice. Pretests were
regard to the questions of interest. Thus, we focus on how conducted to create color differences that were small but
the critical pairs are affected by the between-subjects ma- just noticeable (i.e., noticeable by at least 90% of partici-
nipulation. pants). Both hues fell within the range of colors of orange
The base product was Tropicana pure, pulp-free orange juice available in the market.
juice. The juice was manipulated to create just-noticeable
differences (JNDs) across three levels of sweetness: (1) low Procedure. The four samples of juice were presented in
sweet, which was the pure orange juice, (2) medium sweet, pairs. The positions of the samples within each pair, as well
which was a mixture of 2 grams of Equal Sweetener per as the pairs themselves, were counterbalanced. Participants
800 milliliters of pure orange juice, and (3) high sweet, in the region condition saw that two samples were labeled
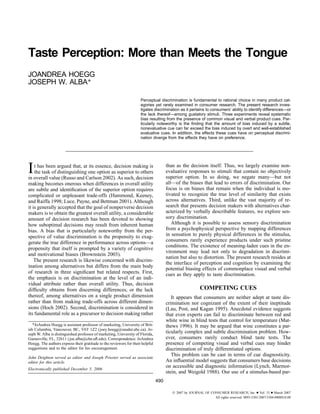
which was a mixture of 6 grams of Equal Sweetener per Florida, and two were labeled California (see fig. 1). They
800 milliliters of pure orange juice. The juice was served were told that they would taste and rate four samples of
in 1.25 ounce Styrofoam cups, filled to the 1 ounce level. orange juice, two from Florida and two from California.
In addition, all participants were given a cracker and 5 They were not given any other information about the juices.
ounces of water to cleanse their palates between taste op- Participants in the control and color conditions received the
portunities. same instructions but without mention of region of origin.
To achieve the desired JNDs, a series of pretests was After tasting all four samples prior to answering any ques-
conducted. Four cups were labeled 1, 2, 3, and 4. Cup 1 tions, participants were asked to express difference judg-
was low sweet, cups 2 and 3 were medium sweet, and cup ments via a seven-point scale (where 1 p identical taste)
4 was high sweet. Participants rated the similarities of three for three randomly presented comparisons: (1) low sweet
critical pairs (1 vs. 2, 2 vs. 3, and 3 vs. 4) on a five-point versus medium sweet, (2) medium sweet versus medium
scale ranging from zero (identical) to four (different). The sweet, and (3) medium sweet versus high sweet. Participants
end result was a desired difference between the similarity were permitted to taste the samples again both during and
rating of pair 1 and pair 2 (MP1 p 2.31 vs. MP2 p 1.00, after making their ratings. Pairs 1 and 3 are variants of a
t(12) p 2.44, p ! .05) as well as between pair 2 and pair taste test in which the two samples have different taste char-
3 (MP2 p 1.00 vs. MP3 p 2.54, t(12) p 3.99, p ! .05) acteristics. A follow-up test showed that, as expected, ratings
and a desired lack of difference between pairs 1 and 3 given to these pairs did not differ from each other (paired
(t(12) p .59, NS). Thus, participants properly perceived t-test, p 1 .50); for simplicity, responses to these pairs were
the difference between the low-sweet and medium-sweet collapsed to create a single rating for pairs with different
samples and the difference between the medium-sweet and tastes. Proper discrimination, of course, would be reflected
high-sweet samples as greater than the difference between in lower numerical scores (because 1 p identical taste) for
the two identical samples. The absolute difference between pairs that have the same taste than for pairs that have dif-
4. TASTE PERCEPTION 493
FIGURE 1
STIMULI PRESENTATION FOR EXPERIMENT 1
NOTE.—Sweetness and cues were counterbalanced.
ferent tastes. Inasmuch as these are critical test pairs, how- control, such that participants perceived a significantly greater
ever, it is important to keep in mind that pairs that possess difference in the taste of two identical samples than in the
identical tastes also were characterized by different colors taste of two different samples (MDIFF p 3.40 vs. MSAME p
or regions of origin; likewise, pairs with different tastes were 4.70; F(1, 19) p 6.57, p ! .05). That is, the visual cue dom-
identical in color and reputed region of origin. Only the inated the taste cue.
control condition rendered taste judgments in the absence
of any other cues.
Discussion
Results The control condition indicates that the taste manipula-
tions fell within participants’ ability to discriminate. Relative
Across all experiments, a total of 13 participants failed to the control, the region condition showed an effect of label.
to complete the task or follow instructions and were removed We made no predictions regarding the biasing effect of la-
from the analysis. In addition, outlier analysis at the 95% bels, and the present result is open to interpretation. An
level resulted in the deletion of an additional eight partic- uninteresting explanation invokes experimental demand. Ex-
ipants across the three studies. The removal of the outliers periment 2 renders this explanation unlikely. It is also pos-
did not materially affect the pattern of results in any of the sible that the labels created an expectation-based bias. As
studies. A 3 (region label, color, control) # 2 (same vs. noted, prior research on taste that has focused on affective
different taste) mixed ANOVA revealed a significant inter- response has shown that prior beliefs can influence aesthetic
action, F(2, 54) p 8.71, p ! .01. There was no main effect reaction and preference (Hoyer and Brown 1990). In the
of the nontaste cue (F(2, 54) p 1.24, p 1 .25) and no effect present case, the strength of prior beliefs regarding an or-
of stimuli (F ! 1). Figure 2 graphically depicts the inter- ange’s region of origin is difficult to calibrate against the
action. The control group fared well, with participants ap- prior beliefs associated with familiar brands used in previous
propriately perceiving less similarity in pairs with different research. It is generally known that Florida oranges are cul-
tastes than pairs with identical tastes (MDIFF p 4.63 vs. tivated primarily for their superior juice-making ability, and
MSAME p 3.05; F(1, 18) p 10.98, p ! .01). Participants in therefore our participants’ discrimination ratings may have
the region condition perceived equal degrees of similarity, been driven by affective expectations. However, rather than
regardless of the true taste difference between samples within speculate, experiment 2 includes label conditions that help
a pair (MDIFF p 4.33 vs. MSAME p 4.39; F ! 1). In contrast, interpret the present result.
the color condition exhibited a pattern opposite to that of the Regardless, the condition of focal interest in the present
5. 494 JOURNAL OF CONSUMER RESEARCH
FIGURE 2 Method
EXPERIMENT 1: DIFFERENCE RATINGS BY CONDITION
Design and Participants. The color and control con-
ditions were retained from experiment 1. Two additional
conditions presumed to induce stronger expectation replaced
the region condition: a brand condition and a price condition.
Two familiar brands were used in the brand condition: Tro-
picana 100% Pure Premium and Winn-Dixie (an every-day-
low-price store), the latter described as being made from
concentrate. In the price condition, no brand was identified,
but the true local prices for a 2 liter container of these two
brands, $3.29 and $1.89, were used to label the samples.
Thus, the design was a 4 (brand priors, price priors, color,
control) # 2 (same taste vs. different taste) mixed design,
with the first factor manipulated between participants and
taste manipulated within participant. A total of 152 under-
graduate students at the University of Florida were randomly
assigned to the four between-subjects conditions.
Stimuli and Procedure. Unlike the preceding experi-
ment, a natural manipulation of taste was achieved by using
actual Tropicana and Winn-Dixie products. Participants in
experiment is the color condition. Participants in this con- the brand condition were (correctly) told that both brands
dition showed a different pattern from those in the control consisted of pure unsweetened Florida orange juice that dif-
condition, thereby satisfying the minimal criterion for an fered in manufacturer and whether they were fresh squeezed
effect of color. Moreover, differentiation via a color cue led (Tropicana) or from concentrate (Winn-Dixie). Although
to exaggeration of differences across color boundaries and only two taste levels were used, the test still consisted of
homogenization of tastes within a single color. In fact, the four samples (see fig. 3). In the control condition the samples
color condition showed a pattern opposite to that of the were labeled 1, 2, 3, and 4. For all other conditions the
control condition. Conflict between color and taste was re- samples were divided into two pairs, each consisting of one
solved in favor of color. Because the color differences were true sample of Tropicana and one true sample of Winn-Dixie
subtle and counterbalanced, it is unlikely that perception juice. The between-participants factor was crossed with the
was driven by expectations of superior taste by one hue true taste. For example, in the brand condition, both samples
versus another. in one mixed-taste pair were labeled Tropicana, and both
The strength of the visual dominance effect in the present samples in the other mixed-taste pair were labeled Winn-
experiment can only be measured against the control con- Dixie. The design therefore enabled construction of critical
dition and the relatively weak semantic effect of region. We comparisons involving pairs with the same taste but different
next compare the effect of color to the influence of semantic brand names and pairs with different tastes (i.e., from dif-
manipulations known from consumer research to induce ferent manufacturers) but the same brand name. Correspond-
strong prior beliefs. ing stimuli were created for the other conditions. In the price
condition, the brand names were replaced by $3.29 and
$1.89; in the color condition, one pair (cups 1 and 2 or cups
3 and 4) was slightly darker than the other. The procedure
was similar to the one described for experiment 1, with the
EXPERIMENT 2 exception that participants in the brand and price conditions
were told that they would be sampling juices from different
In the present experiment we created stronger label ma- brands or with different retail prices.
nipulations to assess the relative ability of color cues to
influence taste discrimination. A large body of research doc- Results
uments the biasing effects of brand names and prices on
consumer perceptions of, and beliefs about, product quality. A two-way mixed ANOVA revealed neither a main effect
Brand names and prices are often viewed as reliable signals of the nontaste cue manipulation, F ! 1, nor of the taste
of quality, sometimes to the extent that they dominate strong manipulation, F(1, 148) p 1.99, p 1 .15, but did reveal a
and more valid counterevidence (Broniarczyk and Alba significant two-way interaction, F(3, 148) p 4.18, p ! .01,
1994; Hoyer and Brown 1990). The question posed in the as depicted in figure 4. The control group correctly provided
present experiment concerns how the visual cue manipulated higher difference ratings for mixed-taste pairs than for same-
in the preceding experiment compares to these more familiar taste pairs (MDIFF p 4.24 vs. MSAME p 3.34; F(1, 37) p
cues in a taste-discrimination context. 4.47, p ! .05). Neither the brand group (MDIFF p 4.34 vs.
6. TASTE PERCEPTION 495
FIGURE 3
STIMULI USED IN EXPERIMENT 2
NOTE.—Cues were counterbalanced.
MSAME p 3.53; F(1, 37) p 3.58, p ! .07) nor the price vestigated these conditions not with an eye toward their
group (MDIFF p 3.79 vs. MSAME p 3.55; F ! 1) showed a individual effects but rather as reference points for the effect
tendency to rate the samples differently, although each group of color. In terms of relative manipulation strength, it could
was more closely aligned with the control condition than be argued that the color manipulation was weak, given the
with the color condition. The color group’s perception of JNDs in hue, whereas the brand and price manipulations
taste was dominated by color, with significantly higher FIGURE 4
difference ratings for same-taste pairs of different hues
(MSAME p 4.53) than for mixed-taste pairs of the same hue EXPERIMENT 2: DIFFERENCE RATINGS BY CONDITION
(MDIFF p 3.68), F(1, 37) p 5.70, p ! .05, consistent with
experiment 1.
Discussion
The control group again perceived a significantly greater
difference between distinct samples than between identical
ones, confirming that the products were distinguishable in
the absence of conflicting cues. Surprisingly, and in contrast
to the robust effect of prior beliefs reported in other domains,
the discrimination pattern observed in the brand condition
was almost identical to that of the control condition; the
pattern observed in the price condition also was directionally
consistent with accurate perception but not statistically so.
Any effect of such manipulations, of course, is driven by
the strength of the manipulations. We opted for naturally
occurring differences in brand image and price and therefore
cannot speak to their absolute strength. However, we in-
7. 496 JOURNAL OF CONSUMER RESEARCH
were relatively strong, with the levels of brand and price that the two operate differently within the chosen product
residing near the end points of their respective real-world category.
ranges. Taken together, these manipulations and results il-
lustrate the strong effect of color in an ecologically valid EXPERIMENT 3
taste-discrimination task.
Experiment 3 separately examines discrimination and
The Role of Expectations. Speculation regarding the preference in the critical brand and color conditions. To
source of the color effect should be made with some caution. test whether the effect reported in experiments 1 and 2 is
On the one hand, analogous research that has investigated limited to complex stimulus contexts, the study was con-
visual-proprioceptive conflict suggests a primarily percep- ducted entirely between subjects, focusing only on the per-
tual process. On the other hand, our use of color as a visual ceived difference between two samples of identical-tasting
cue and color-taste conflict as the context make it difficult orange juice.
to rule out a more cognitive influence. That is, color may
have created expectations. To investigate this possibility we
conducted a follow-up experiment using only the brand,
Method
price, and color conditions. Participants were asked to in- Task (discrimination vs. preference) and cue (brand vs.
dicate the difference in taste they would expect to find be- color) were manipulated between subjects. A total of 184
tween orange juices that differed along each dimension. Spe- undergraduate students at the University of Florida were
cifically, participants in the brand condition were asked, randomly assigned to the four between-subjects conditions.
“How much difference would you expect between the taste The study was conducted using Tropicana 100% Pure
of Tropicana 100% pure orange juice and Winn-Dixie 100% Premium orange juice. Each participant received two 1.25
orange juice from concentrate?” Participants in the price ounce cups of juice, each filled to the 1 ounce level. For
condition were asked, “How much difference would you participants in the brand conditions, one cup was labeled
expect between the taste of orange juice priced at $3.29 for Tropicana and the other was labeled Winn-Dixie (counter-
2 liters and orange juice priced at $1.89 for 2 liters?” Par- balanced). For participants in the color condition, the cups
ticipants in the color condition were shown the two colors were simply labeled 1 and 2, but the juice in one of the
and were asked, “How much difference would you expect cups had been darkened in the same manner as earlier studies
between the taste of orange juice 1 and orange juice 2?” (counterbalanced).
Eighty-two participants took part in the experiment. On a Participants were provided with two cups of orange juice,
scale from one (no difference) to seven (a lot of difference), a napkin, an unsalted cracker, and 5 ounces of water. They
participants indicated an expected taste difference of 4.38, were instructed to taste both samples of juice and, depending
4.73, and 4.00 for the brand, price, and color conditions, on condition, indicate the perceived difference or the extent
respectively, F(2, 79) p 1.48, p 1 .23. Thus, expectations of of their preference for one or the other sample. As in pre-
difference were equivalent across cues, and, moreover, the vious studies, participants were permitted to taste and retaste
lowest absolute expected difference was observed in the the juices during the rating task. Discrimination was mea-
color condition. Clearly, the major result from the main sured on a seven-point scale ranging from “exactly the
experiment cannot be attributed to differential expectations. same” (one) to “completely different” (seven); preference
Indeed, the color manipulation, which produced the greatest was measured on a seven-point scale ranging from “no pref-
deviation from the control condition, is directionally asso- erence” (one) to “strong preference” (seven). For those in
ciated with the weakest expectation of difference. the preference condition who indicated a preference (i.e., a
It is noteworthy that the brand and price conditions in the rating higher than one), a follow-up question probed which
main experiment did not exhibit significant bias. Although of the two samples was preferred.
both represent powerful purchase cues, neither has been
examined in a controlled taste-discrimination setting. We Results
are unfamiliar with any studies that examine the effect of
price on taste. Investigations of the effect of branding on The discrimination results mirrored those of experiment 2.
taste show dramatic effects but tap preference rather than Participants in the color condition perceived a significantly
taste discrimination (Allison and Uhl 1964; Hoyer and greater difference between the taste of the two samples than
Brown 1990). This distinction between preference and per- did participants in the brand condition (MCOLOR p 3.86 ver-
ceived similarity offers an interesting and important oppor- sus MBRAND p 3.28, t(97) p 2.41, p ! .05). In contrast, par-
tunity for future research. Experiment 3 takes an incipient ticipants in the color condition indicated less preference
step in this direction by trying to rule out an uninteresting for one sample or the other than participants in the brand
explanation. One reason for the divergent effects of branding condition (MCOLOR p 3.08 versus MBRAND p 3.90, t(79) p
on preference versus discrimination may involve the product 2.06, p ! .05). These results cannot be directly compared
context. Insofar as consumers view orange juice as com- because of the differences in the scales, but the reversal in
modity-like, the influence of the brand manipulation may direction clearly indicates a dissociation between discrimi-
have been suppressed. Thus, to draw conclusions about dis- nation and preference. Among those participants who in-
crimination versus preference, it is first necessary to confirm dicated a preference, 67% preferred Tropicana ( p ! .07)—as
8. TASTE PERCEPTION 497
anticipated by prior research. There was no difference in trust in the manufacturer, a desire for prestige, and other
preference for color (55% vs. 45% for dark vs. light, re- lower- and higher-order processes.
spectively). The results from all three experiments can be viewed from
Overall, the discrimination results illustrate the robustness the perspective of cue diagnosticity. In the evaluative con-
of our preceding findings in a simpler stimulus environment; texts in which diagnosticity is typically invoked, it is be-
the preference results illustrate the robustness of prior research lieved that consumers identify those cues that provide the
on branding and preference. The combined results show that most reliable predictors and differentiators of utility. In the
the discrimination pattern reported in experiments 1 and 2 is context of discrimination, intuition suggests that taste would
not driven by commodity-based reasoning on the part of the provide the most diagnostic cue, whereas analogous pref-
participants. erence research suggests that brand and price information
would also be heavily weighted. The present results are
consistent with neither. Unlike the companion construct of
GENERAL DISCUSSION accessibility, the determinants of diagnosticity are not well
developed and may, in fact, be task specific.
Consumer research has paid little attention to the impor- A deeper understanding of the underlying processes pro-
tant issue of perceptual discrimination. The present research vides an obvious target for future research. So too does the
represents an attempt to address the problem. We find a nature of the taste stimulus. The present experiments ex-
large effect of a subtle color manipulation but, moreover, amined differences along a single taste dimension, but most
an effect that far outstrips the effects of less subtle brand taste products exhibit far greater complexity. An important
and price information. Although we had no strong expec- question is whether the correspondence between a label and
tations regarding the relative influence of these competing one dimension (e.g., sweetness) interferes with perception
cues, we did anticipate that visual dominance would result of differences among samples on other dimensions.
in a nontrivial influence of color on taste discrimination.
A description of the relative contribution of perceptual
and cognitive effects in pure taste-discrimination tasks
awaits additional research, although a definitive account may REFERENCES
prove elusive (Rothbart, Davis-Stitt, and Hill 1997). How-
ever, several lines of evidence favor a perceptual over a Allison, Ralph I. and Kenneth P. Uhl (1964), “Influence of Beer
cognitive account. First, it seems unlikely that our consum- Brand Identification on Taste Perception,” Journal of Mar-
ers deliberately eschewed taste for color as a basis for dis- keting Research, 1 (August), 36–39.
crimination. Moreover, our consumers succumbed to the in- Broniarczyk, Susan M. and Joseph W. Alba (1994), “Theory versus
fluence of color but were less influenced by the powerful Data in Prediction and Correlation Tasks,” Organizational Be-
havior and Human Decision Processes, 57 (January), 117–39.
lure of brand and price information. Our data also show that Brownstein, Aaron L. (2003), “Biased Predecision Processing,”
expectations about the effects of color were no stronger than Psychological Bulletin, 129 (July), 545–68.
the expectations associated with brand and price. Finally, Delwiche, Judy (2004), “The Impact of Perceptual Interactions on
parsimony favors a perceptual explanation, given other Perceived Flavor,” Food Quality and Preference, 15 (March),
demonstrations of visual dominance that appear perceptually 137–46.
driven. Folkes, Valerie and Shashi Matta (2004), “The Effect of Package
We do not claim that labels have no effect on taste dis- Shape on Consumers’ Judgments of Product Volume: Atten-
crimination. The results of experiments 1 and 2 indicate at tion as a Mental Contaminant,” Journal of Consumer Re-
least a small influence of the labels; however, it is possible search, 31 (September), 390–401.
that the influence of a label over discrimination is dependent Garber, Lawrence L., Jr., Eva M. Hyatt, and Richard G. Starr Jr.
(2000), “The Effects of Food Color on Perceived Flavor,”
on other factors, such as prior product experience (Hoegg Journal of Marketing Theory and Practice, 8 (Fall), 59–72.
and Alba 2007). Goldstone, Robert L. (1994), “Influences of Categorization on Per-
The results from experiment 3 suggest that, in contrast, ceptual Discrimination,” Journal of Experimental Psychol-
preference may be driven by a different process. Given that ogy: General, 123 (June), 178–200.
the stimulus array was composed solely of identical samples, Hammond, John S., Ralph L. Keeney, and Howard Raiffa (1998),
the different pattern of results for preference versus dis- “The Hidden Traps in Decision Making,” Harvard Business
crimination is striking. Prior research on preference has not Review, 76 (September–October), 47–58.
isolated the underlying process, but it is reasonable to hy- Hoch, Stephen J. (2002), “Product Experience Is Seductive,” Jour-
pothesize a more cognitive or even social process. Expec- nal of Consumer Research, 29 (December), 448–54.
tations about a sensory experience may shape the experience Hoch, Stephen J. and Young-Won Ha (1986), “Consumer Learning:
Advertising and the Ambiguity of Product Experience,” Jour-
through confirmatory processing, particularly when the ex- nal of Consumer Research, 13 (September), 221–33.
perience is ambiguous (Hoch and Ha 1986). However, other Hoegg, JoAndrea and Joseph W. Alba (2007), “Linguistic Framing
factors may alter preference alone or in combination with of Sensory Experience: There Is Some Accounting for Taste,”
the experience itself. For example, preference for one brand in Psycholinguistic Phenomena in Marketing Communica-
over another—even when the preferred brand has inferior tions, ed. Tina M. Lowrey, Mahwah, NJ: Erlbaum.
sensory qualities—may reflect preference for familiarity, Hoyer, Wayne D. and Steven P. Brown (1990), “Effects of Brand
9. 498 JOURNAL OF CONSUMER RESEARCH
Awareness on Choice for a Common, Repeat-Purchase Prod- count of Its Origins and Significance,” Psychological Review,
uct,” Journal of Consumer Research, 17 (September), 141–48. 83 (March), 157–71.
Krider, Robert E., Priya Raghubir, and Aradhna Krishna (2001), Raghubir, Priya and Aradhna Krishna (1996), “As the Crow Flies:
“Pizzas: Pi or Square? Psychophysical Biases in Area Com- Bias in Consumers’ Map-Based Distance Judgments,” Jour-
parisons,” Marketing Science, 20 (Fall), 405–25. nal of Consumer Research, 23 (June), 26–39.
Lau, Kin-Nam, Gerald Post, and Albert Kagan (1995), “Using ——— (1999), “Vital Dimensions in Volume Perception: Can the
Economic Incentives to Distinguish Perception Bias from Dis- Eye Fool the Stomach?” Journal of Marketing Research, 36
crimination Ability in Taste Tests,” Journal of Marketing Re- (August), 313–26.
search, 32 (May), 140–51. Rothbart, Myron, Carene Davis-Stitt, and Jonathan Hill (1997),
Luce, Mary Frances, John W. Payne, and James R. Bettman (2001), “Effects of Arbitrarily Placed Category Boundaries on Sim-
“The Impact of Emotional Tradeoff Difficulty on Decision ilarity Judgments,” Journal of Experimental Social Psychol-
Behavior,” in Conflict and Tradeoffs in Decision Making,
ogy, 33 (March), 122–45.
ed. Elke Weber and Jonathan Baron, New York: Cambridge,
86–109. Russo, J. Edward and Kurt A. Carlson (2002), “Individual Decision
Lynch, John G., Jr., Howard Marmorstein, and Michael F. Weigold Making,” in Handbook of Marketing, ed. Barton A. Weitz and
(1988), “Choices from Sets including Remembered Brands: Robin Wensley, London: Sage, 371–408.
Use of Recalled Attributes and Prior Overall Evaluations,” Stillman, Jennifer A. (1993), “Color Influences Flavor Identifica-
Journal of Consumer Research, 15 (September), 169–84. tion in Fruit-Flavored Beverages,” Journal of Food Science,
Matthews, Thomas (1996), “The ABC’s of Wine Tasting,” http:// 58 (July–August), 810–12.
www.winespectator.com. Wansink, Brian and Koert van Ittersum (2003), “Bottoms Up! The
Posner, Michael I., Mary Jo Nissen, and Raymond M. Klein Influence of Elongation on Pouring and Consumption Volume,”
(1976), “Visual Dominance: An Information-Processing Ac- Journal of Consumer Research, 30 (December), 455–63.